You will need:
- Kubernetes (I’m using k3s)
- ArgoCD (helpful, but not required)
- ProxmoxVE 7
- InfluxDB 2 from https://helm.influxdata.com/
- kube-prometheus-stack from https://prometheus-community.github.io/helm-charts
- DASHBOARDS
InfluxDB 2 Configuration
I’m using ArgoCD to manage my things. This is my current ArgoCD Application for InfluxDB 2:
apiVersion: argoproj.io/v1alpha1
kind: Application
metadata:
name: influxdb
namespace: argocd
spec:
destination:
namespace: influxdb
server: https://kubernetes.default.svc
project: default
source:
chart: influxdb2
helm:
parameters:
- name: persistence.storageClass
value: democratic-csi-ssd0-iscsi
- name: persistence.size
value: 80Gi
repoURL: https://helm.influxdata.com/
targetRevision: 2.0.1
syncPolicy:
automated:
prune: true
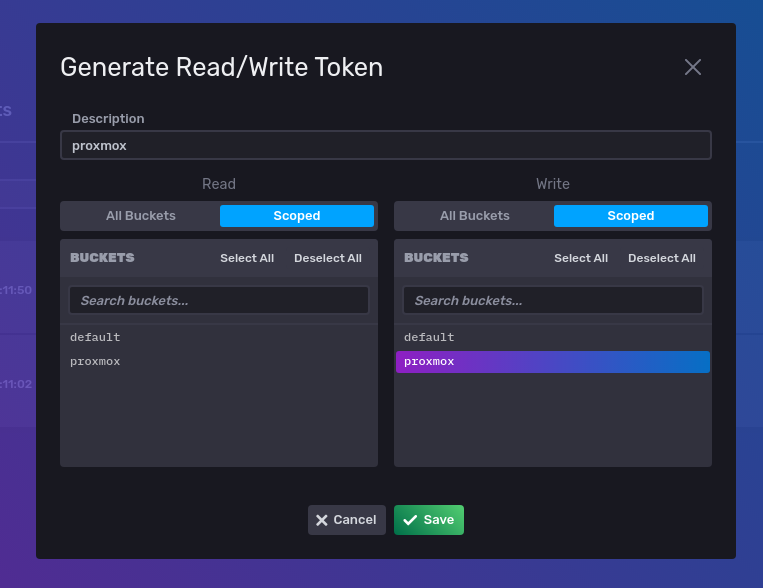
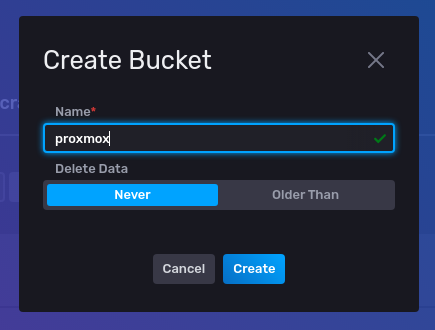
selfHeal: trueOf course there are tons of things you can tweak, but my changes just have to do with persistence/storage. Once I got my InfluxDB instance up and running, I created a bucket and a token for ProxmoxVE to use:
My InfluxDB is exposed publicly using an istio virtualservice and gateway, so I access it using its FQDN. I’m assuming if you’re using Kubernetes and reading this article, you have some familiarity exposing services.
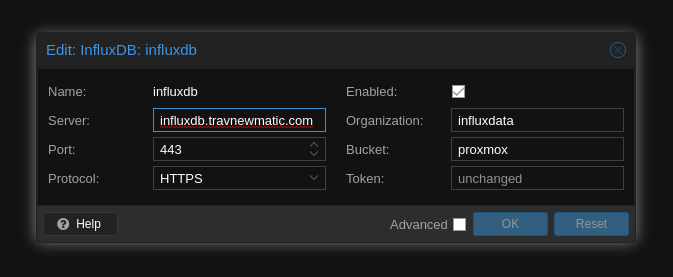
ProxmoxVE Configuration
Point ProxmoxVE at your InfluxDB instance. Configure this in Datacenter > Metric Server > Add. Note the default ‘Organization’ is influxdata. Perhaps this is different if you deploy InfluxDB using some other method.
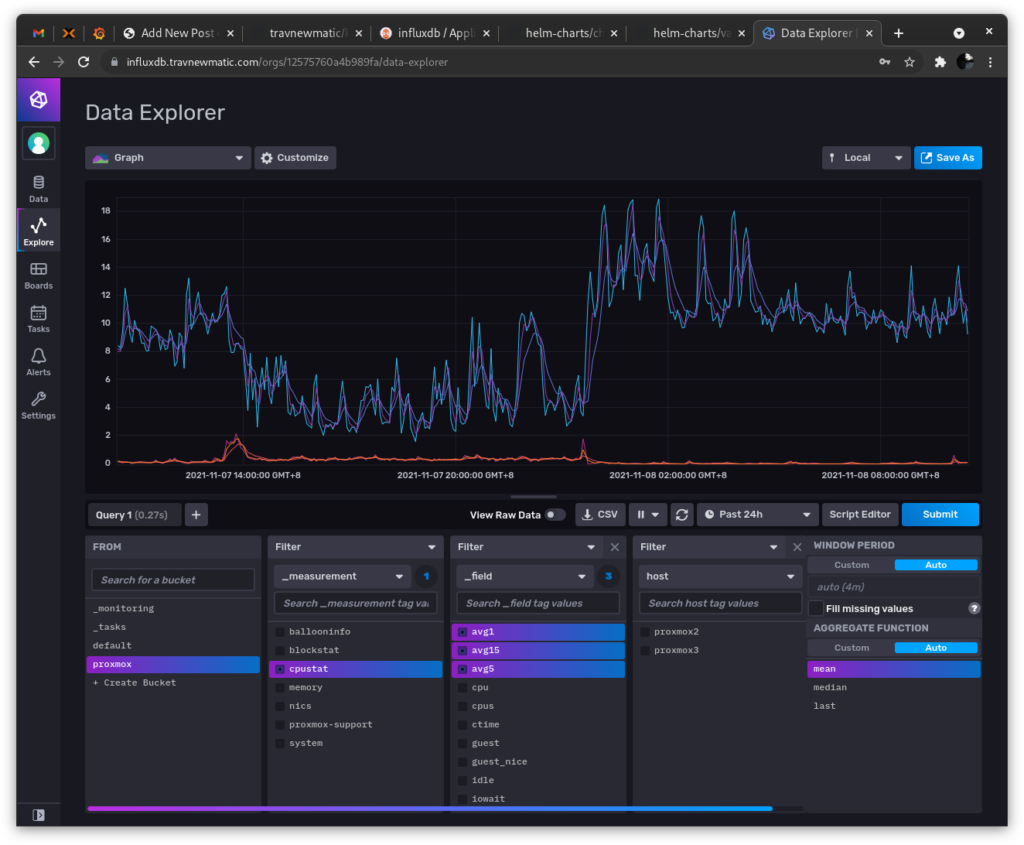
Check to see if ProxmoxVE is actually sending data into InfluxDB
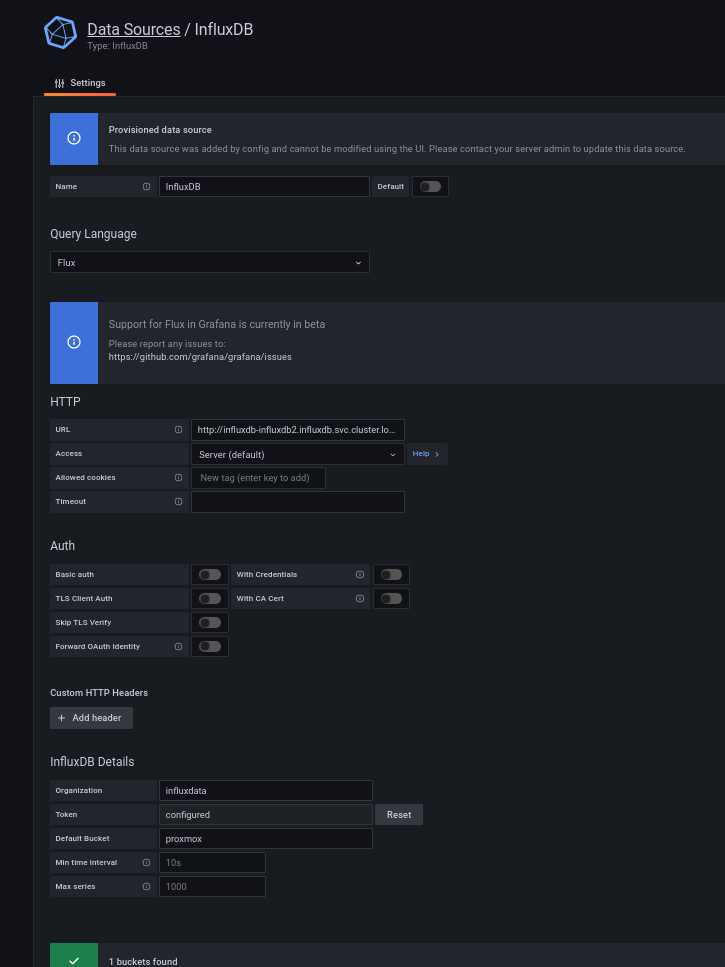
Grafana Configuration
kube-prometheus-stack is really a wonderful thing. I wish I knew how to use kubernetes-monitoring/kubernetes-mixin but I don’t understand jsonnet. And this community helm thing works well enough for my needs. My kube-prometheus-stack ArgoCD application:
apiVersion: argoproj.io/v1alpha1
kind: Application
metadata:
  name: kube-prometheus-stack
  namespace: argocd
spec:
  destination:
    namespace: monitoring
    server: https://kubernetes.default.svc
  project: default
  source:
    chart: kube-prometheus-stack
    helm:
      values: |-
        prometheusOperator.kubeletService.enabled: 'false'
        grafana:
          adminPassword: 'redacted'
          defaultDashboardsTimezone: Asia/Taipei
          additionalDataSources:
          - orgId: 1
            name: InfluxDB
            type: influxdb
            typeName: InfluxDB
            typeLogoUrl: public/app/plugins/datasource/influxdb/img/influxdb_logo.svg
            access: proxy
            url: http://influxdb-influxdb2.influxdb.svc.cluster.local
            password: ''
            user: ''
            database: ''
            basicAuth: false
            isDefault: false
            jsonData:
              defaultBucket: proxmox
              httpMode: POST
              organization: influxdata
              version: Flux
            secureJsonData:
              token: "redacted"
            readOnly: false
          dashboardProviders:
            myproviders.yaml:
              apiVersion: 1
              providers:
                - name: 'custom'
                  orgId: 1
                  folder: 'custom'
                  type: file
                  disableDeletion: true
                  editable: false
                  options:
                    path: /var/lib/grafana/dashboards/custom
          dashboards:
            custom:
              velero:
                gnetId: 15356
                revision: 13
                datasource: InfluxDB
        prometheus:
          prometheusSpec:
            additionalScrapeConfigs: {}
            storageSpec:
              volumeClaimTemplate:
                spec:
                  storageClassName: democratic-csi-ssd0-iscsi
                  accessModes: ["ReadWriteOnce"]
                  resources:
                    requests:
                      storage: 50Gi
    repoURL: https://prometheus-community.github.io/helm-charts
    targetRevision: 19.2.3
  syncPolicy:
    automated:
      prune: true
      selfHeal: true
    syncOptions:
    - CreateNamespace=true
Things to change:
- Grafana password
- InfluxDB token (using the default admin token, create another if you like)
- Prometheus persistent storage config
Assuming everything works correctly, this application will deploy Grafana with our InfluxDB datasource pre-configured. Very convenient 🙂
Confirm we can get data in Grafana:
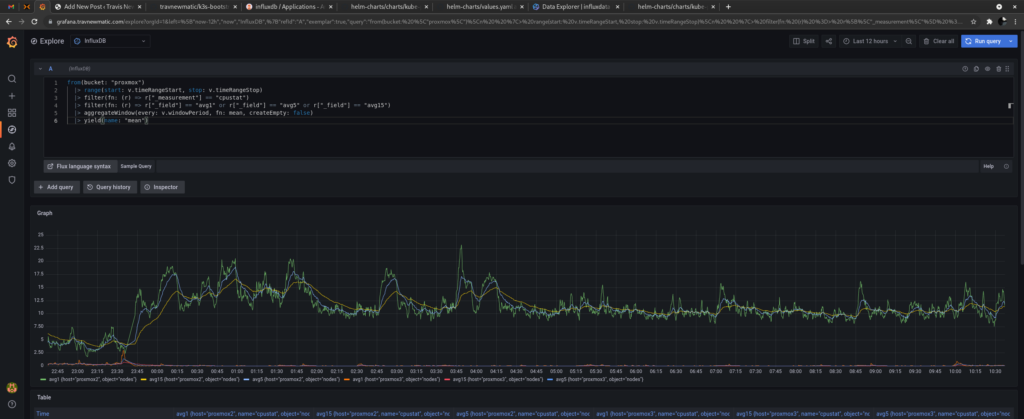
To do
Dashboards
There are some dashboards, but most (all) of them seem to be for InfluxDB 1.x, which won’t work in this setup. I need to look at some existing dashboards and adjust the queries to work with InfluxDB 2 (using the Flux query language). Shouldn’t be too terrible, and would be a good way to improve my Grafana chops.
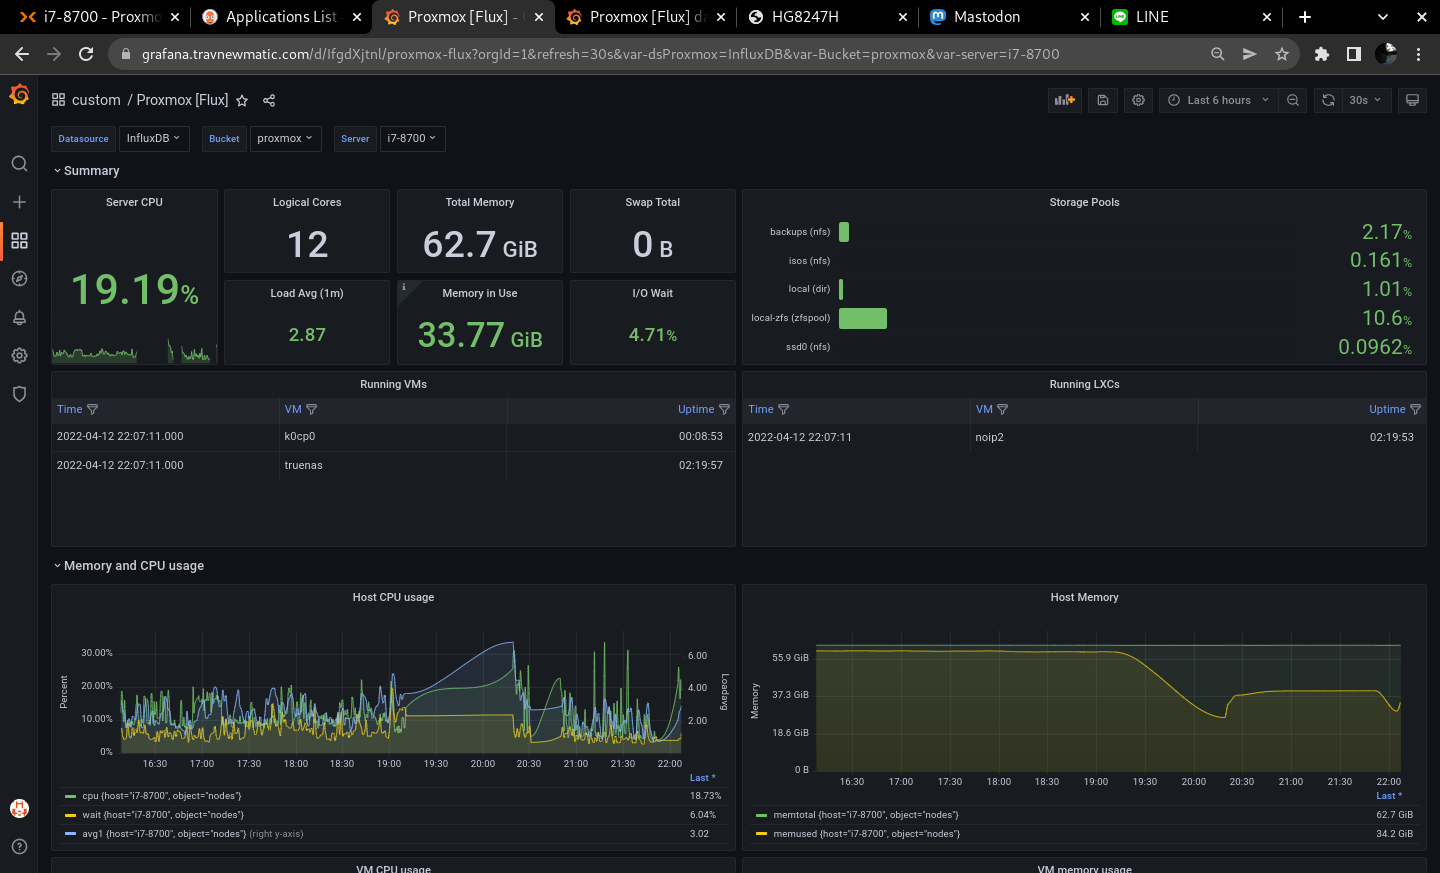
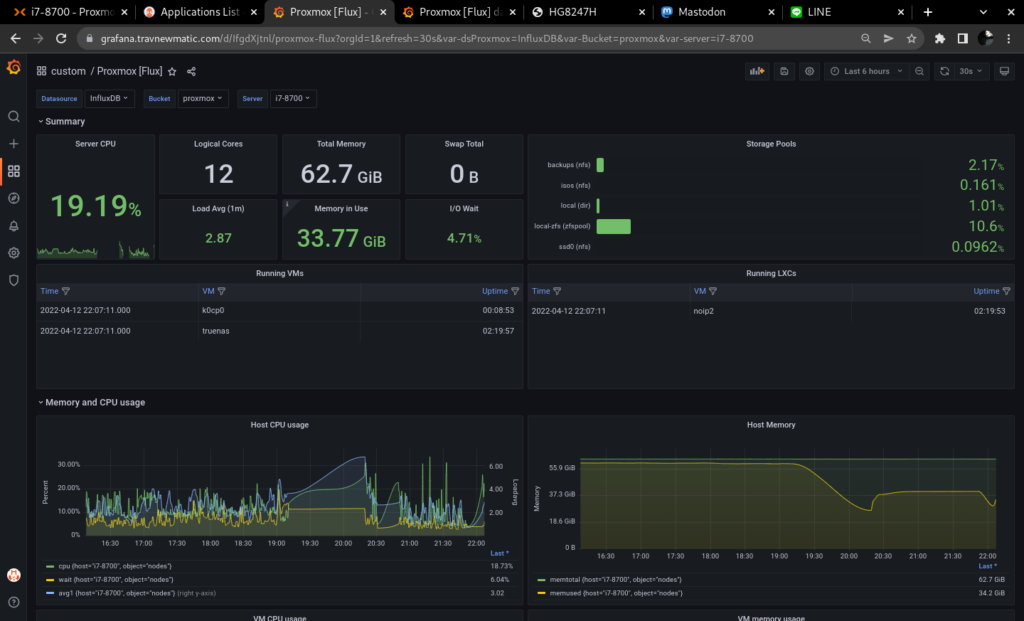
WE GOT DASHBOARDS! And they work!
I have some ideas for some tweaks, but for now, this is totally fine.
Alerts
Probably a good idea, but not sure where or how I would do it. In a perfect world I should use the AlertManager included with kube-prometheus-stack. Another project for another weekend.
Leave a Reply