
Mastodon environment variable, see https://docs.joinmastodon.org/admin/config/
STATSD_ADDR=127.0.0.1:9125Added a statsd-exporter container to my Mastodon pod, see https://hub.docker.com/r/prom/statsd-exporter/
spec:
containers:
- image: prom/statsd-exporter
imagePullPolicy: IfNotPresent
name: statsd-exporter
ports:
- containerPort: 9125
name: listen
protocol: UDP
- containerPort: 9102
name: web
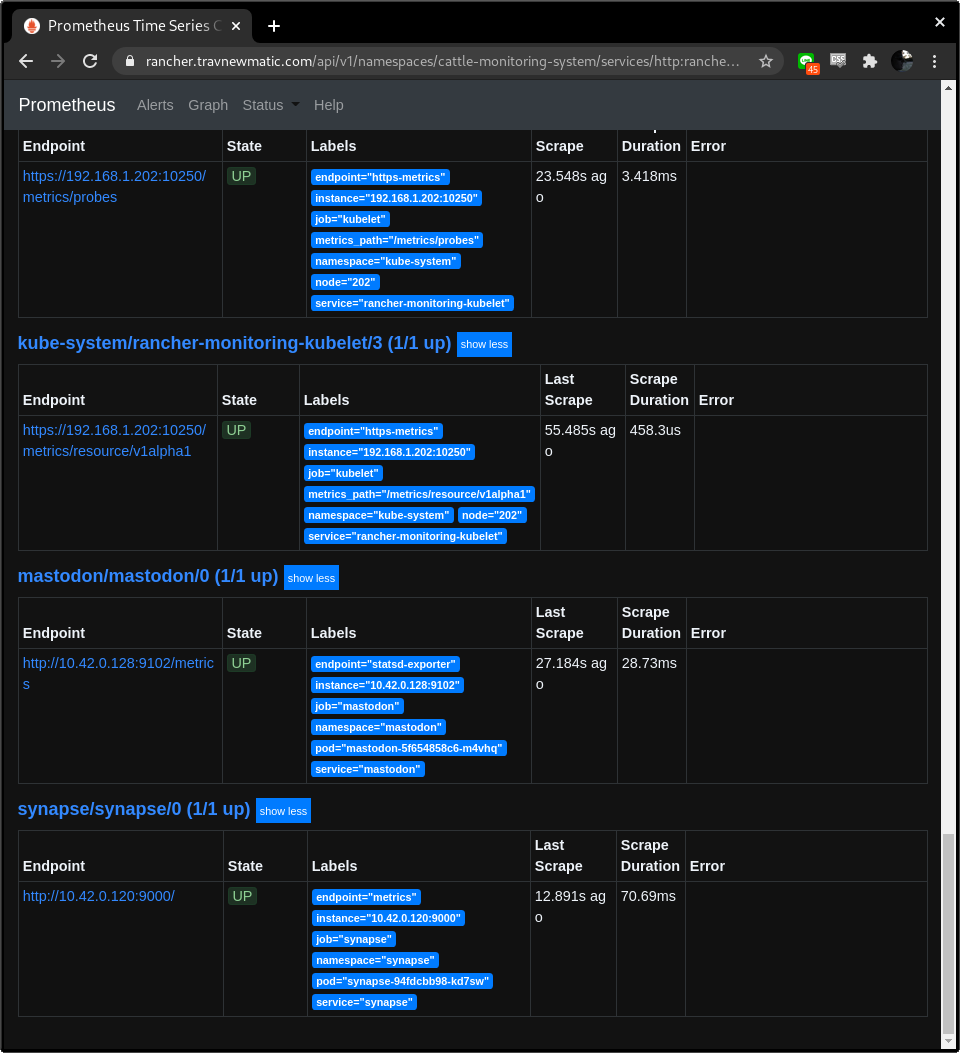
protocol: TCPThis article has a nice intro on how to get going with servicemonitor resources. Make sure your’ve got your labels set!
apiVersion: v1
kind: Service
metadata:
  labels:
    app: mastodon
  name: mastodon
  namespace: mastodon
spec:
  ports:
  - name: statsd-exporter
    port: 9102
    protocol: TCP
    targetPort: 9102
  - name: mastodon
    port: 80
    protocol: TCP
    targetPort: 80
  selector:
    app: mastodon
  sessionAffinity: None
  type: ClusterIP
apiVersion: monitoring.coreos.com/v1
kind: ServiceMonitor
metadata:
labels:
app: mastodon
name: mastodon
namespace: mastodon
spec:
endpoints:
- interval: 30s
path: /metrics
port: statsd-exporter
scheme: http
namespaceSelector:
matchNames:
- mastodon
selector:
matchLabels:
app: mastodon
Leave a Reply