Travis Newman
Blog
About
FAQs
Posts
Tag:
grafana
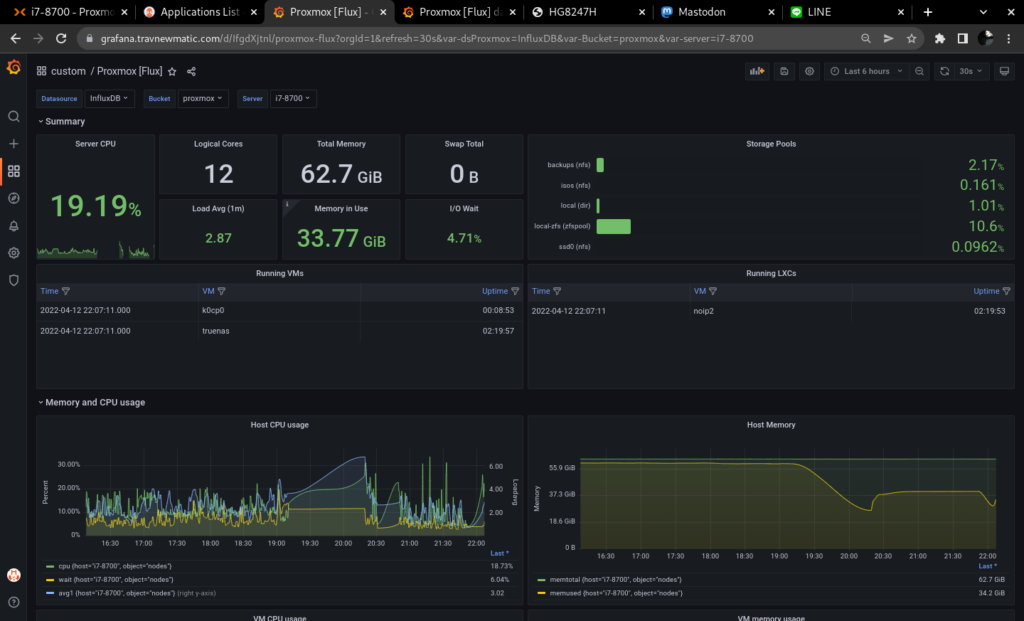
ProxmoxVE Monitoring with InfluxDB 2 and Grafana
Woo dashboards!
You will need:
Kubernetes (I’m using k3s)
ArgoCD (helpful, but not required)
ProxmoxVE 7
InfluxDB 2 from
https://helm.influxdata.com/
kube-prometheus-stack from
https://prometheus-community.github.io/helm-charts
DASHBOARDS
(more…)
November 8, 2021
Grafana, Promtheus, Node-exporter, and cAdvisor
https://github.com/stefanprodan/dockprom/tree/master/grafana/provisioning/dashboards
has some nice dashboards
https://prometheus.io/docs/guides/cadvisor/
tells how to get cadvisor (docker container metrics) stuff into prometheus
https://prometheus.io/docs/guides/node-exporter/
has instructions on how to get host metrics via node-exporter
June 4, 2020